Where you see
what you measured
iNuba Clinic turns every scanner measurement
into charts, comparisons and reports
you understand at a glance.

Lots of data.
Nobody reads it.
Measuring is the easy part. The problem comes next: loose numbers in a CSV, measurements you cannot compare and a report your client does not understand.
Raw data. The scanner returns hundreds of variables and nobody knows which ones to look at.
Isolated measurements. Each scan lives on its own, with nothing to compare it against.
Manual transcription. Export, copy and paste into a spreadsheet just to see it.
Reports that say nothing. Tables of numbers the client opens once and never again.
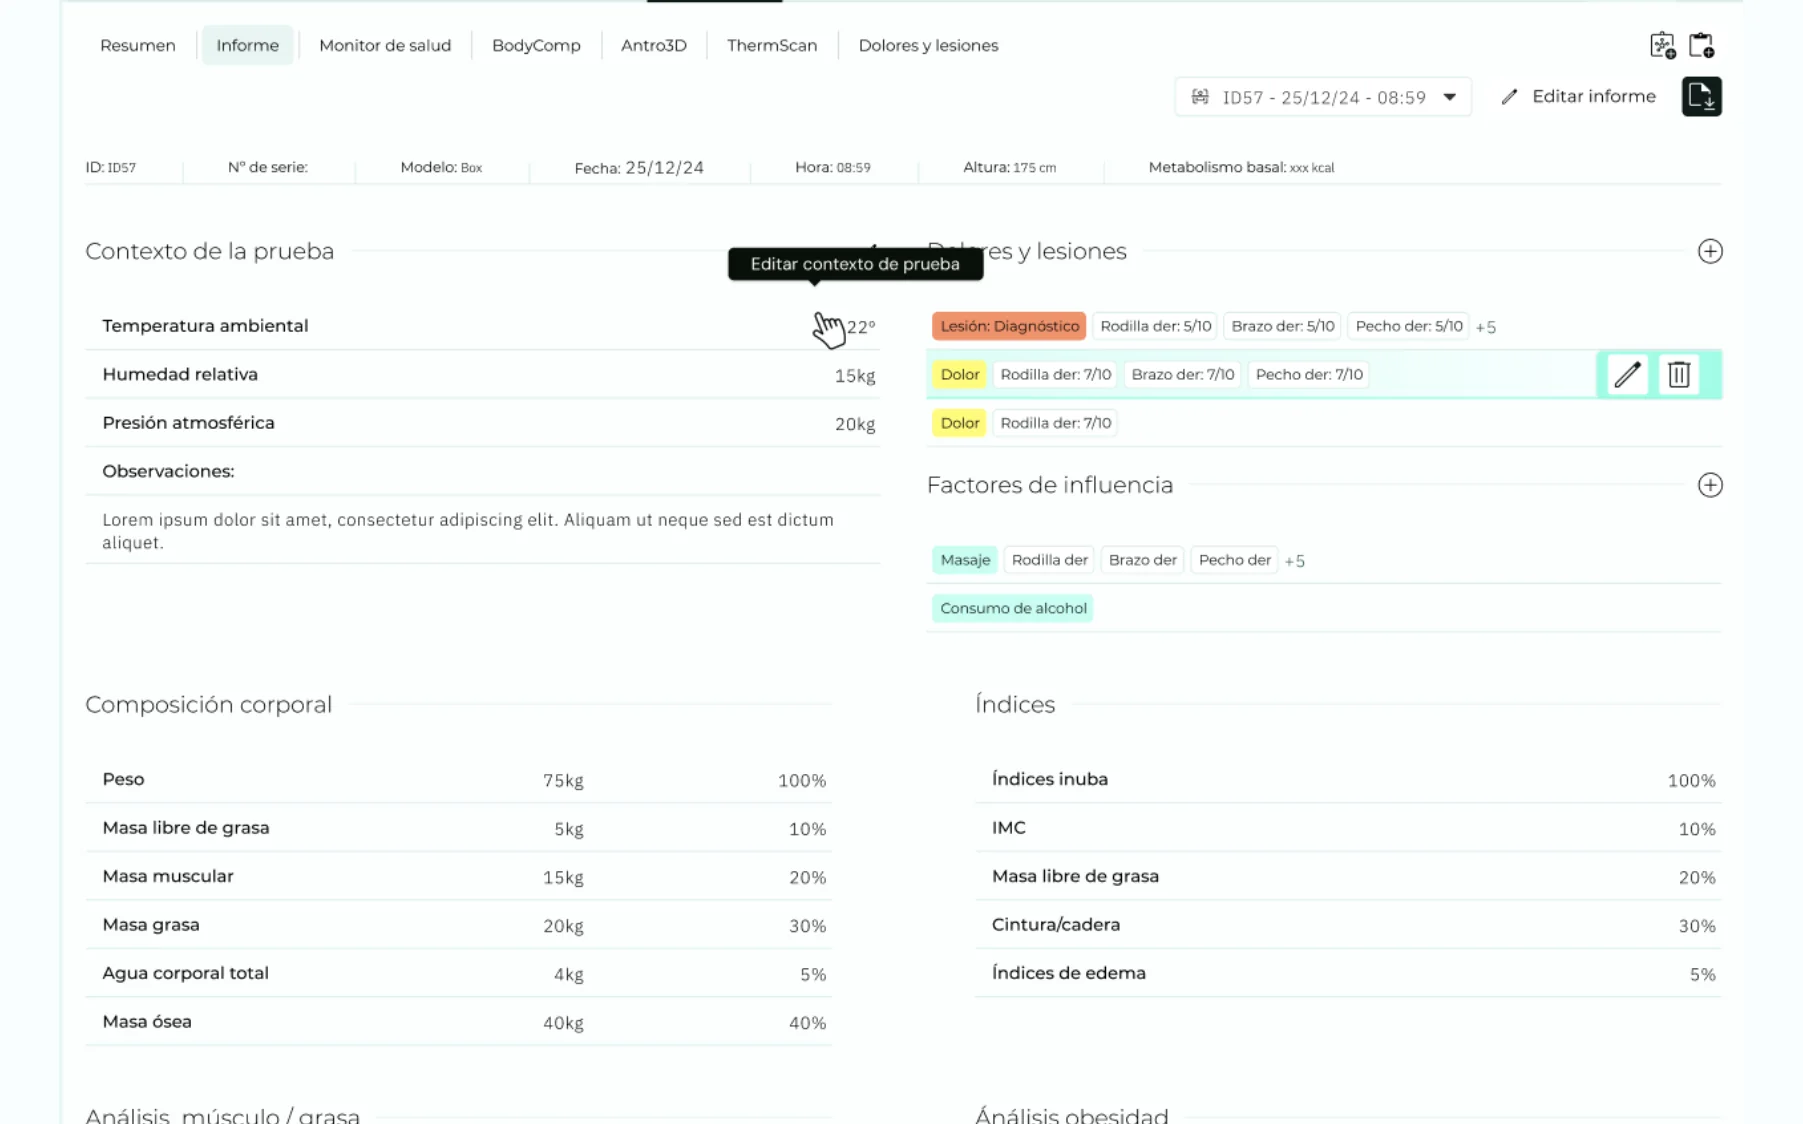
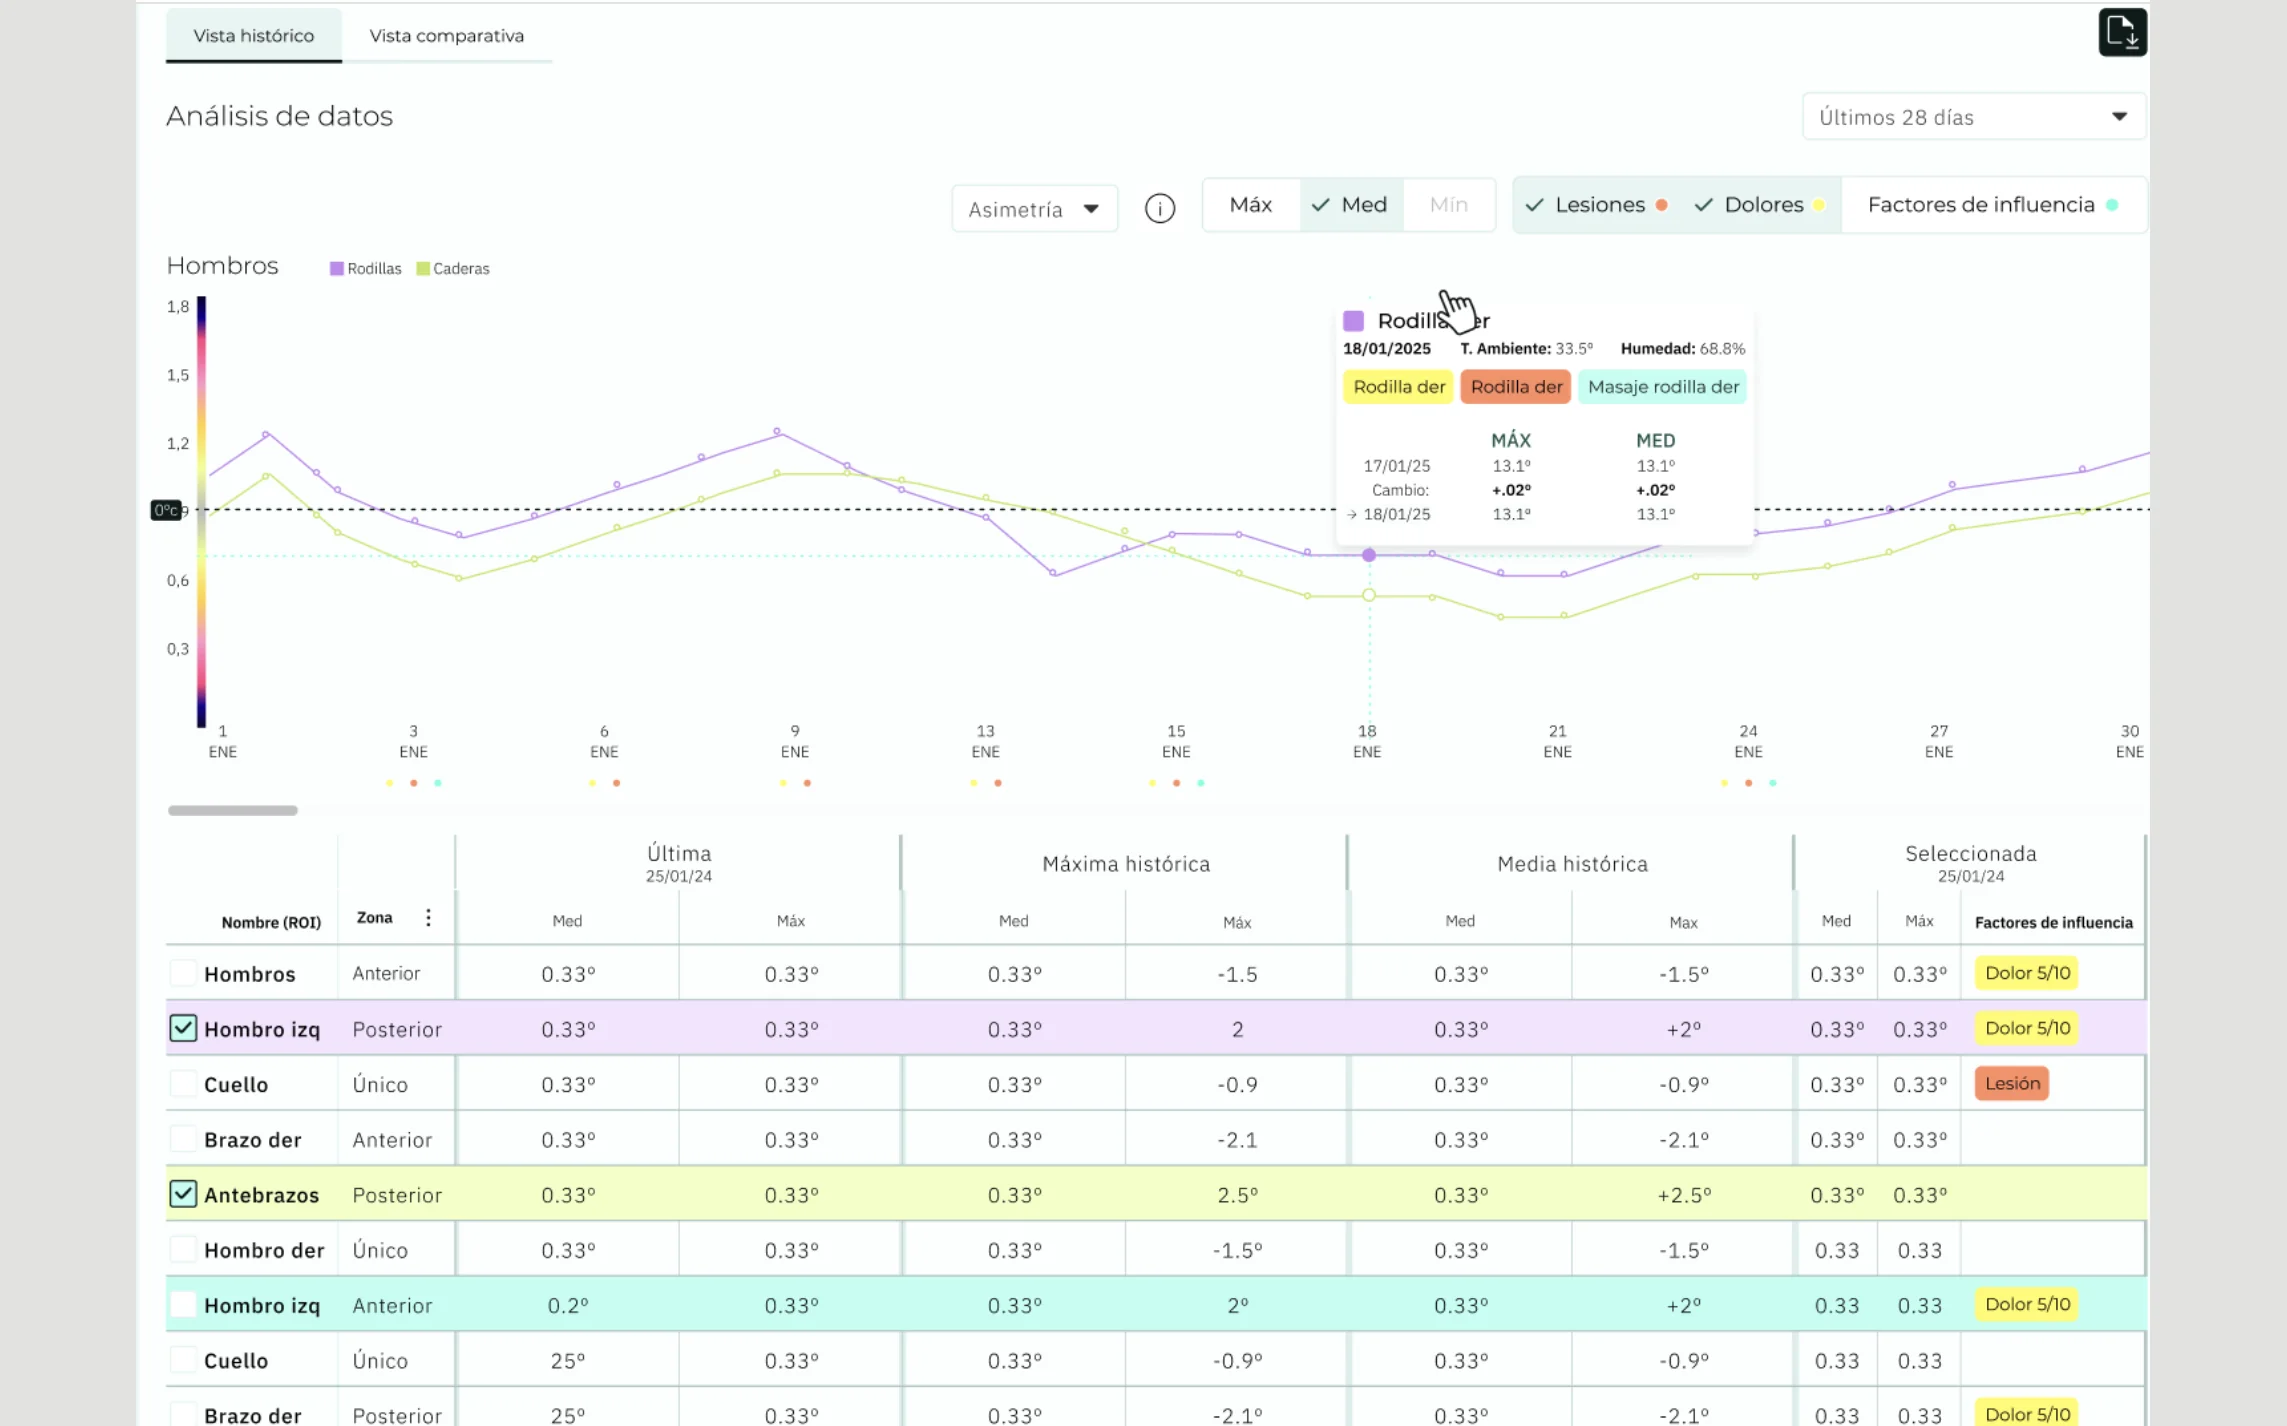
Everything the hardware measures, on one screen
iNuba Clinic receives the scanner measurement and turns it into something you can read, compare and hand over.
What changes
in your day-to-day
What centres notice from the very first measurement with iNuba Clinic.
Immediate reading
You open the measurement and understand the body state without interpreting numbers.
Zero transcription
Data goes from scanner to software without exporting or copying anything.
Visible progress
The trend of each metric, measurement after measurement.
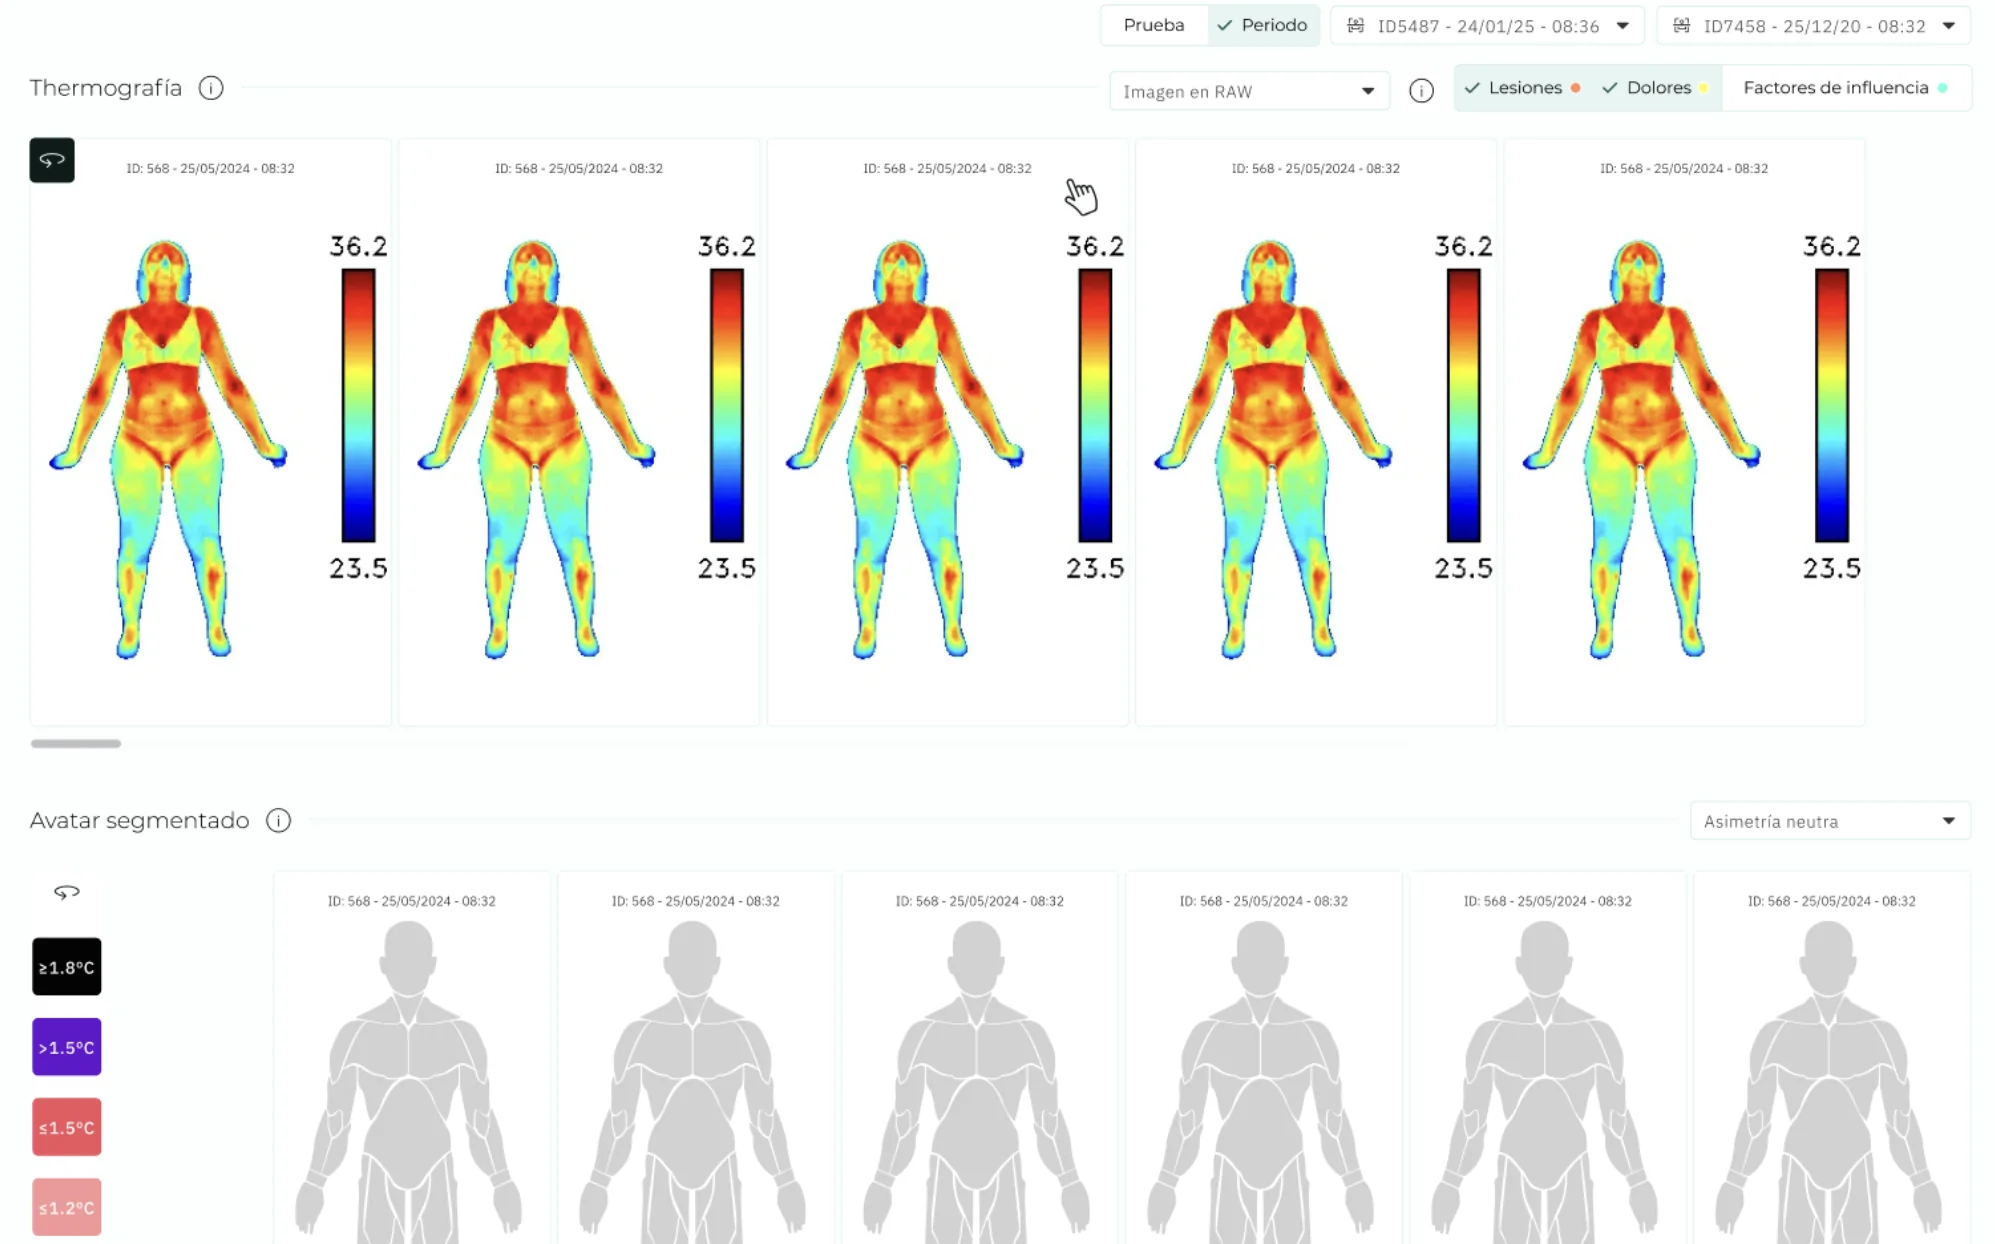
Clear comparisons
Before and after side by side, with the difference already calculated.
Reports in one click
A presentable document generated from the measurement itself.
Objective argument
You show measured data, not subjective perceptions.
Their data, on your
client's phone
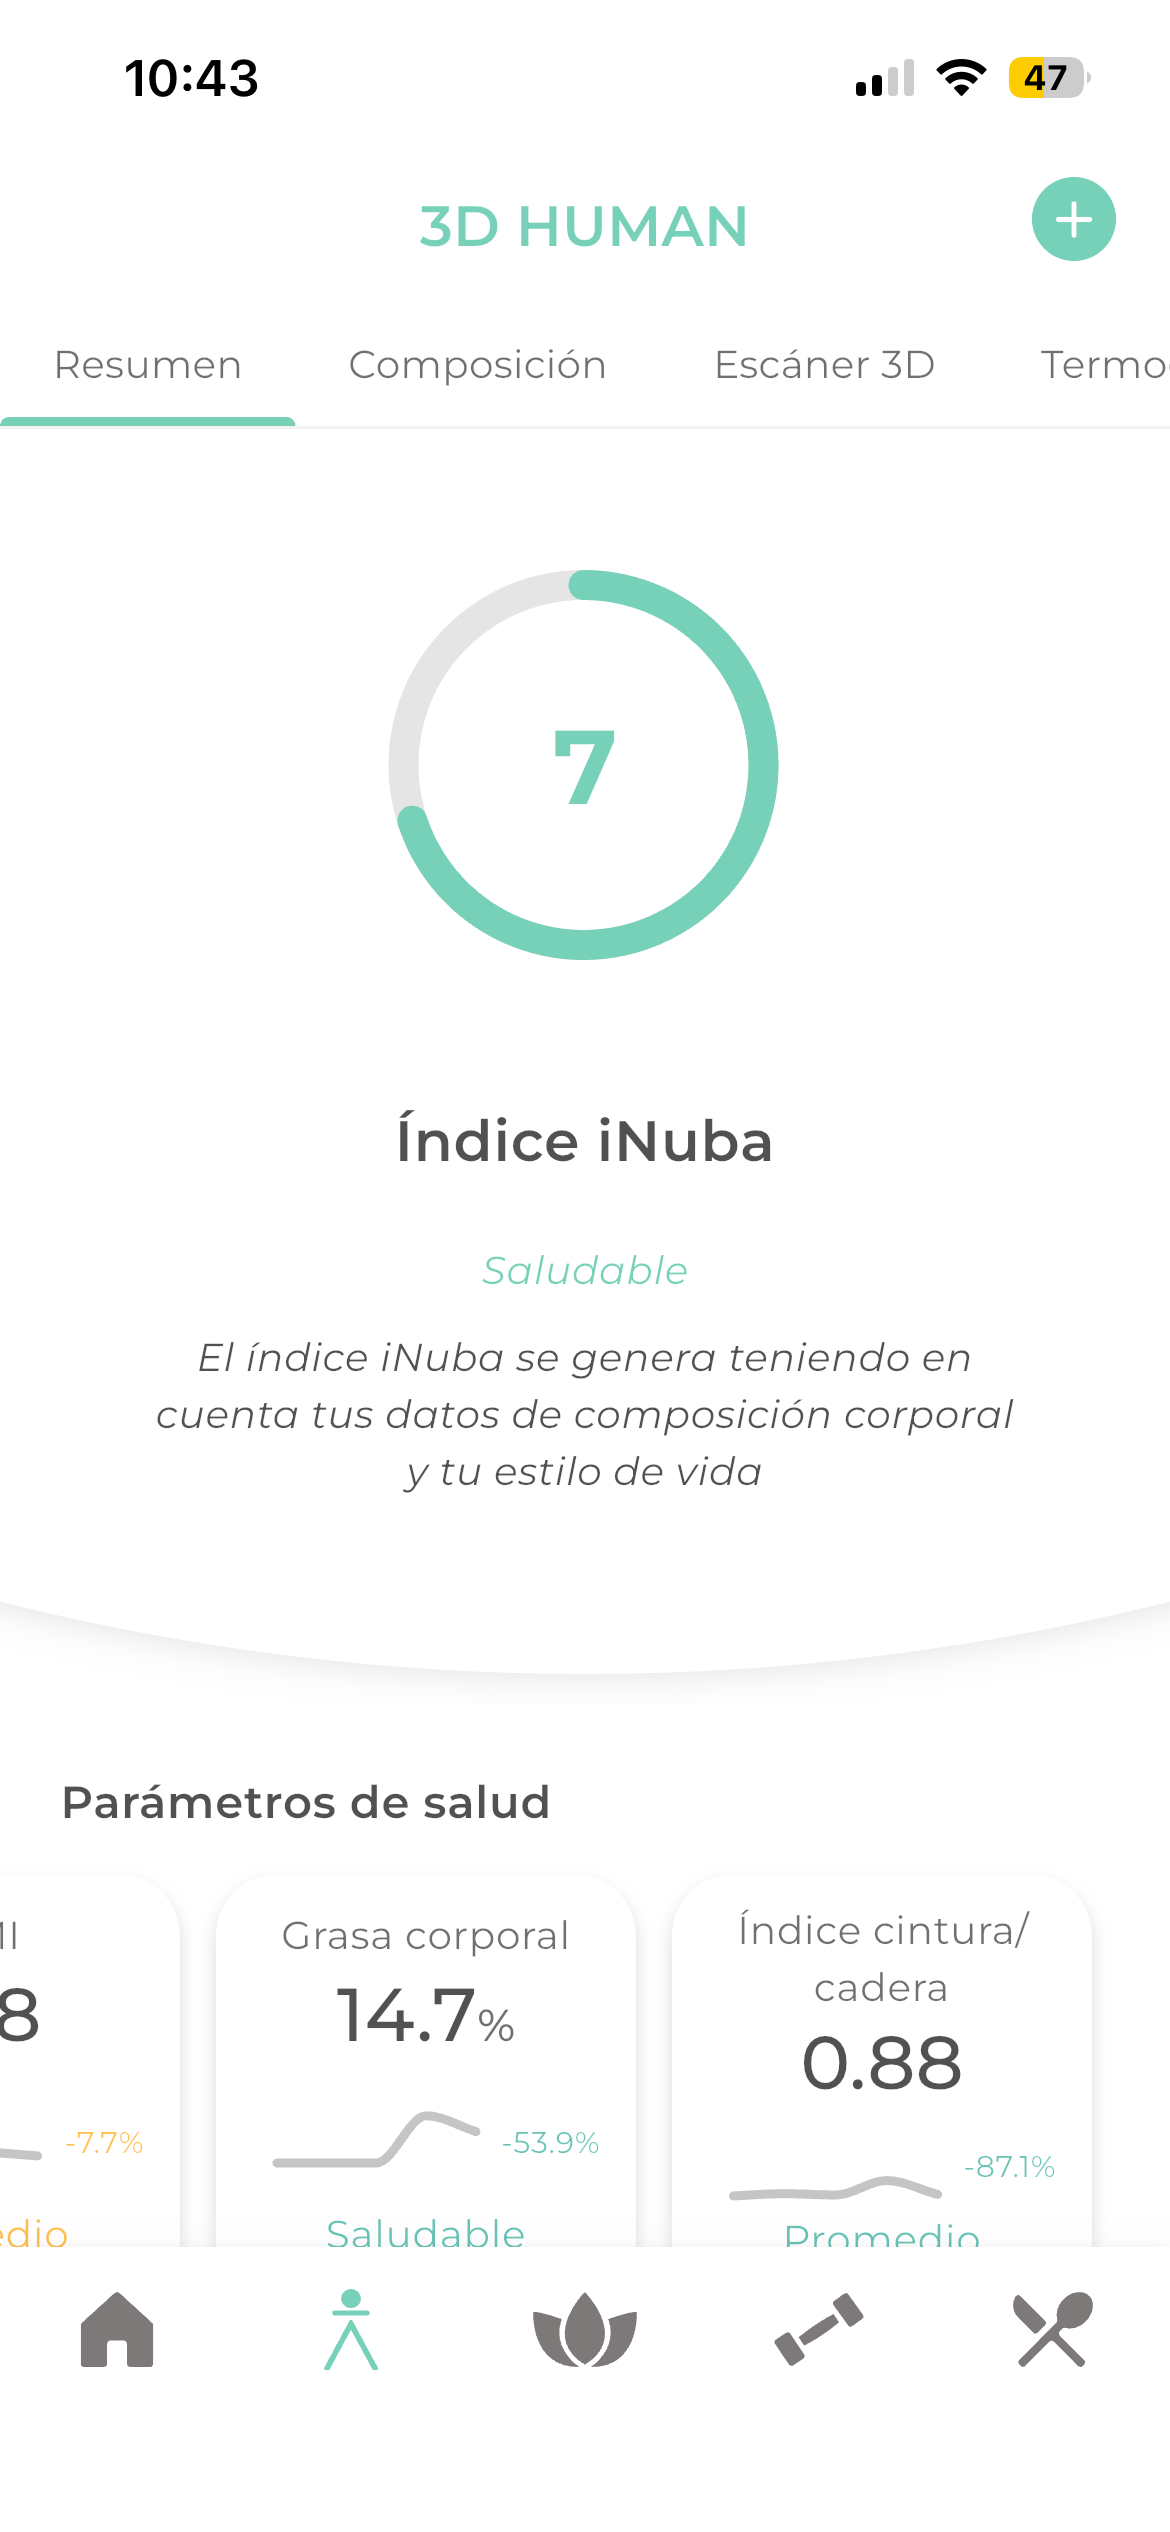
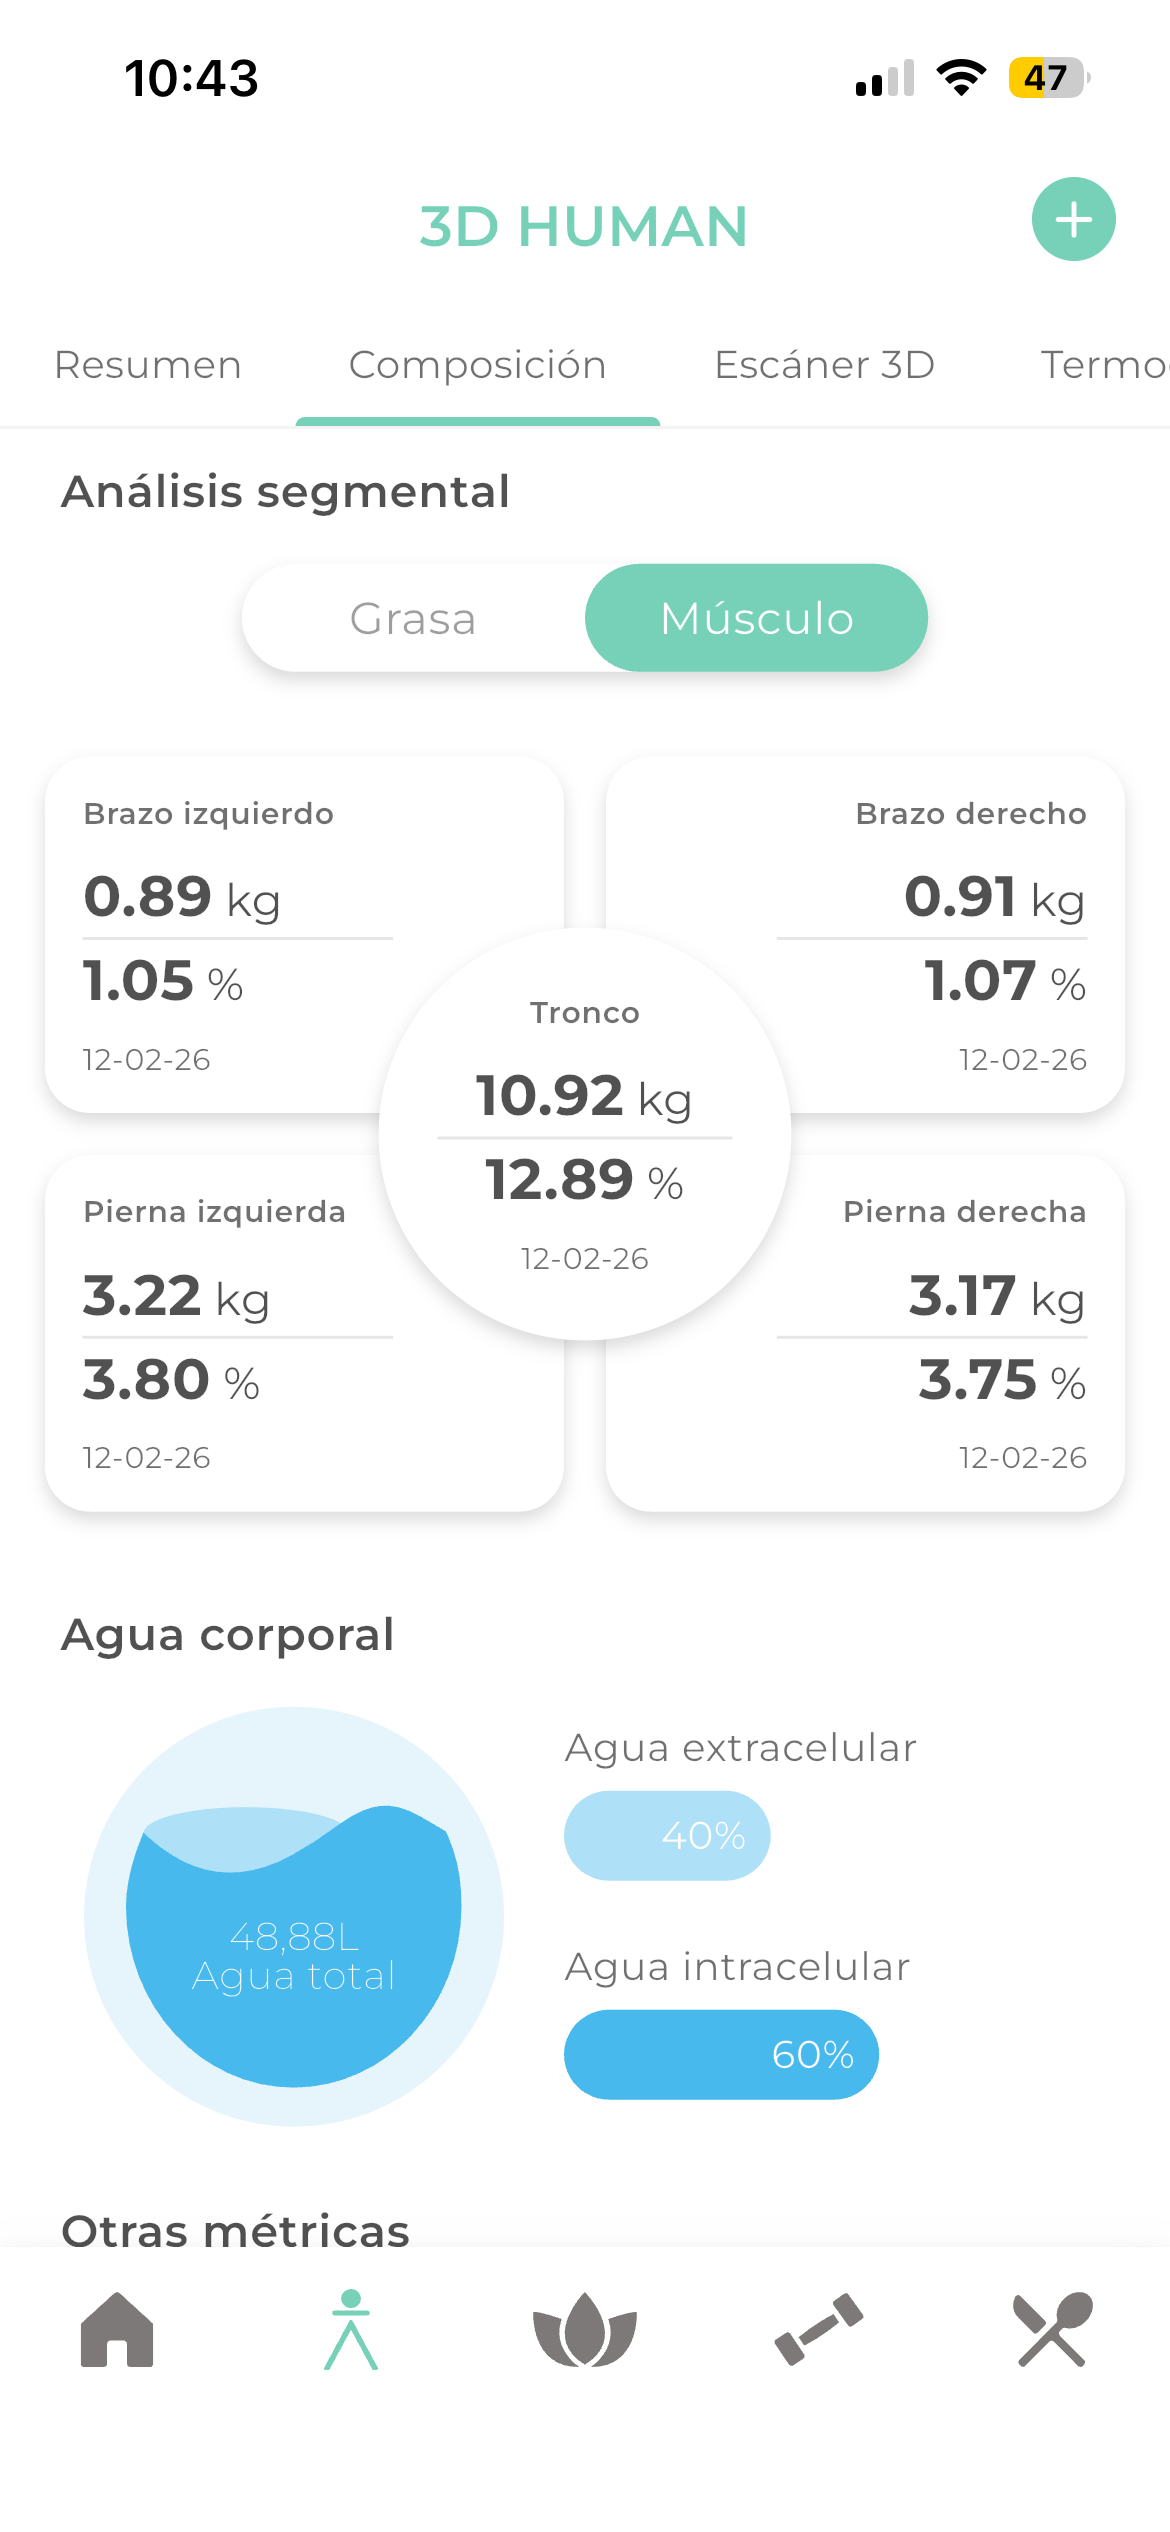
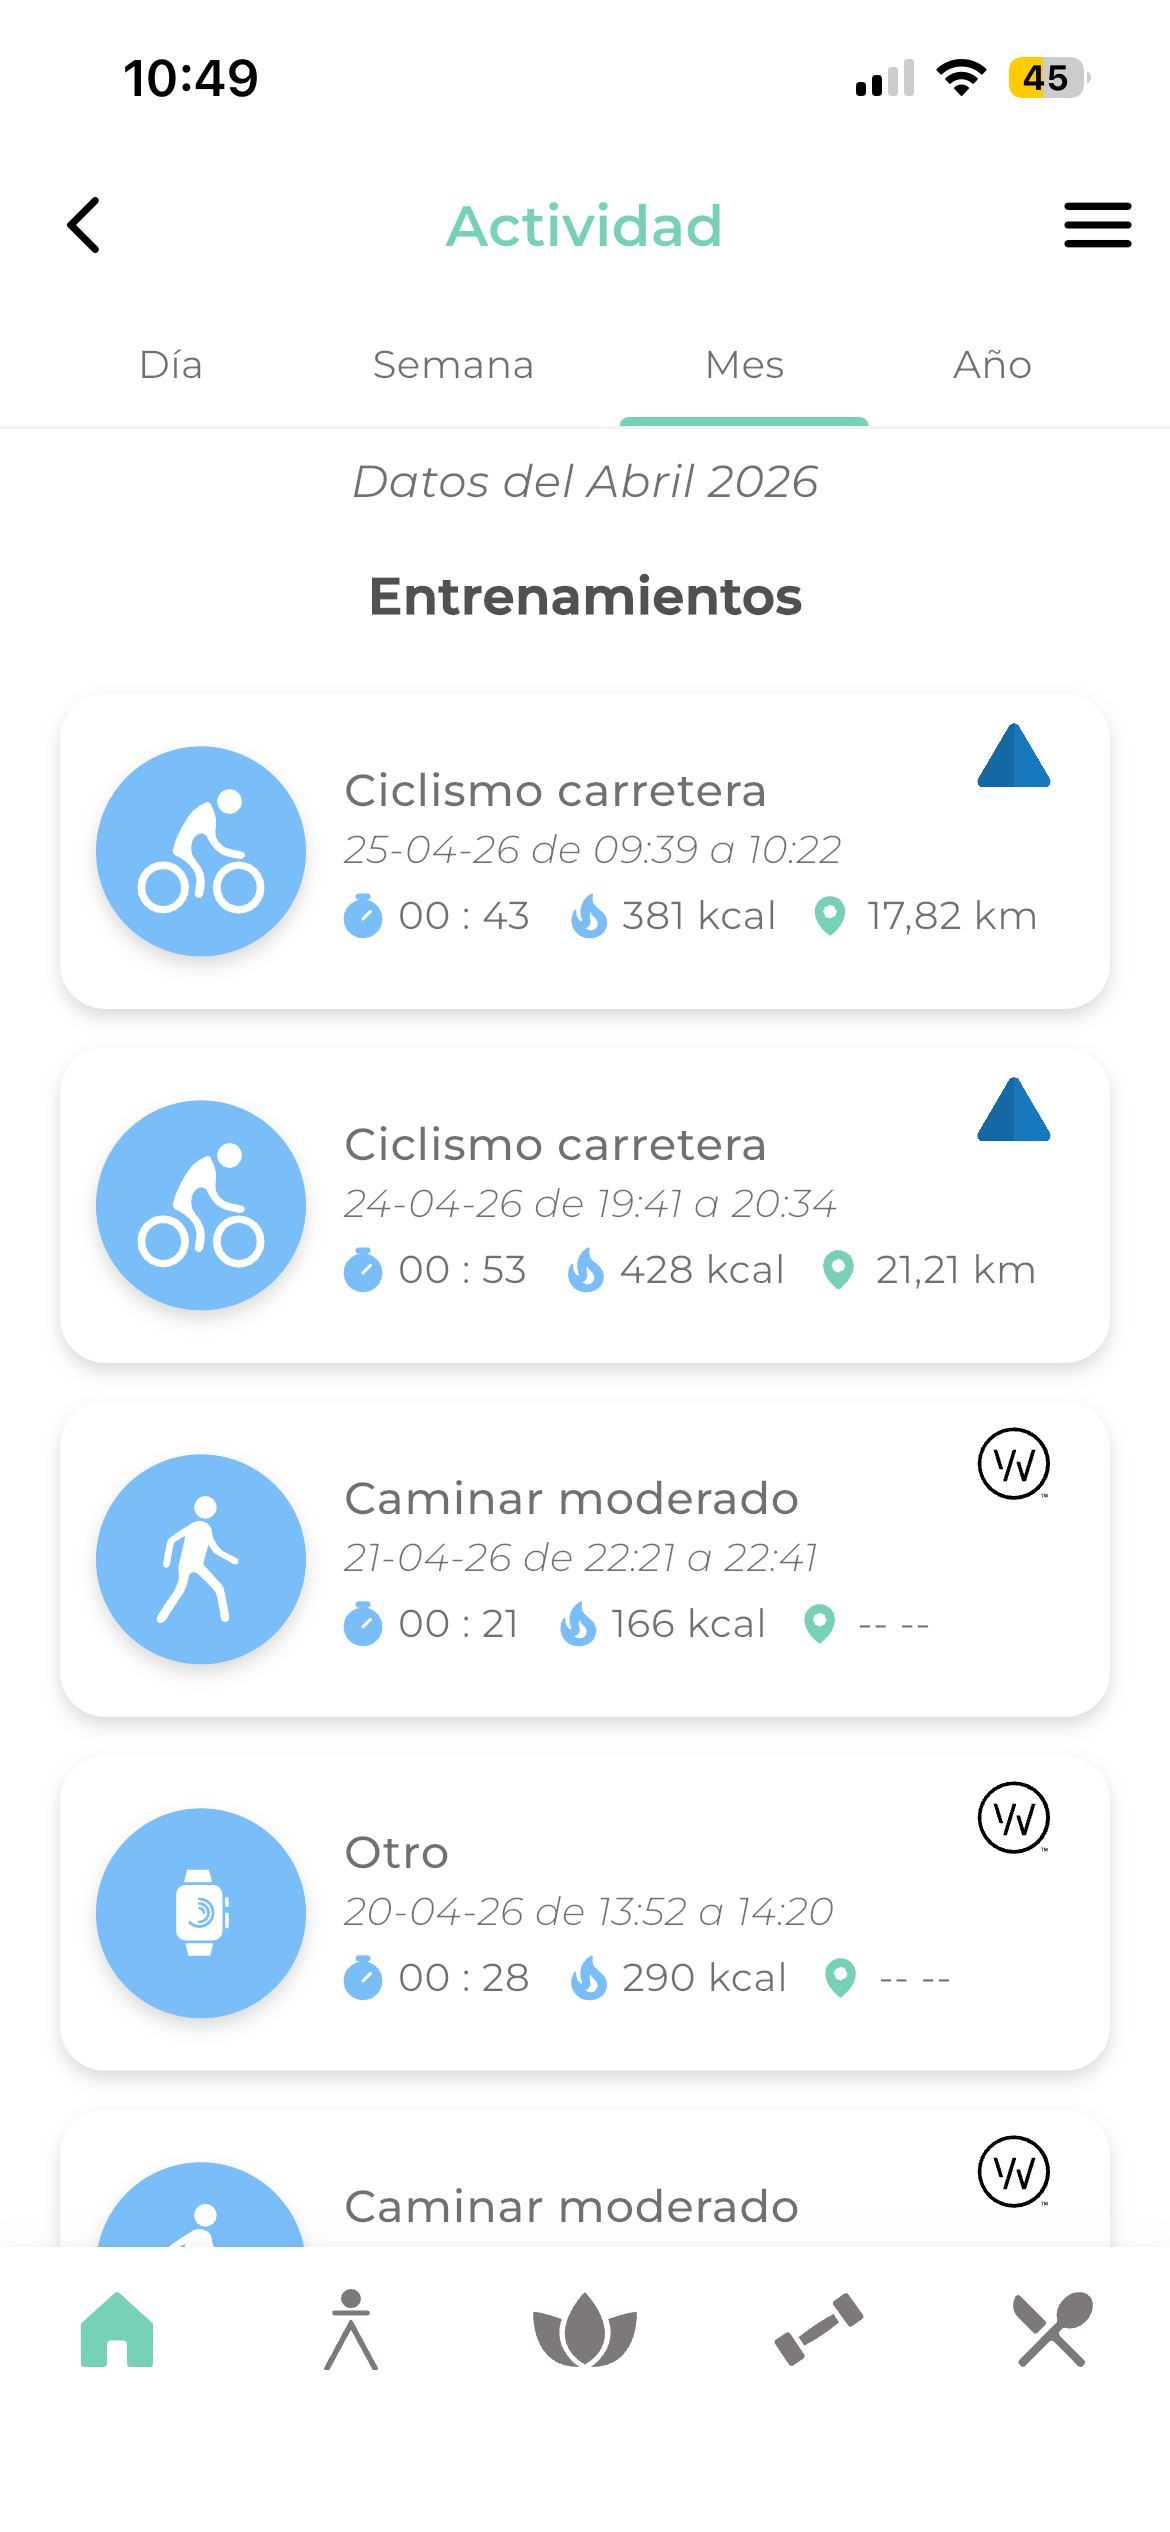
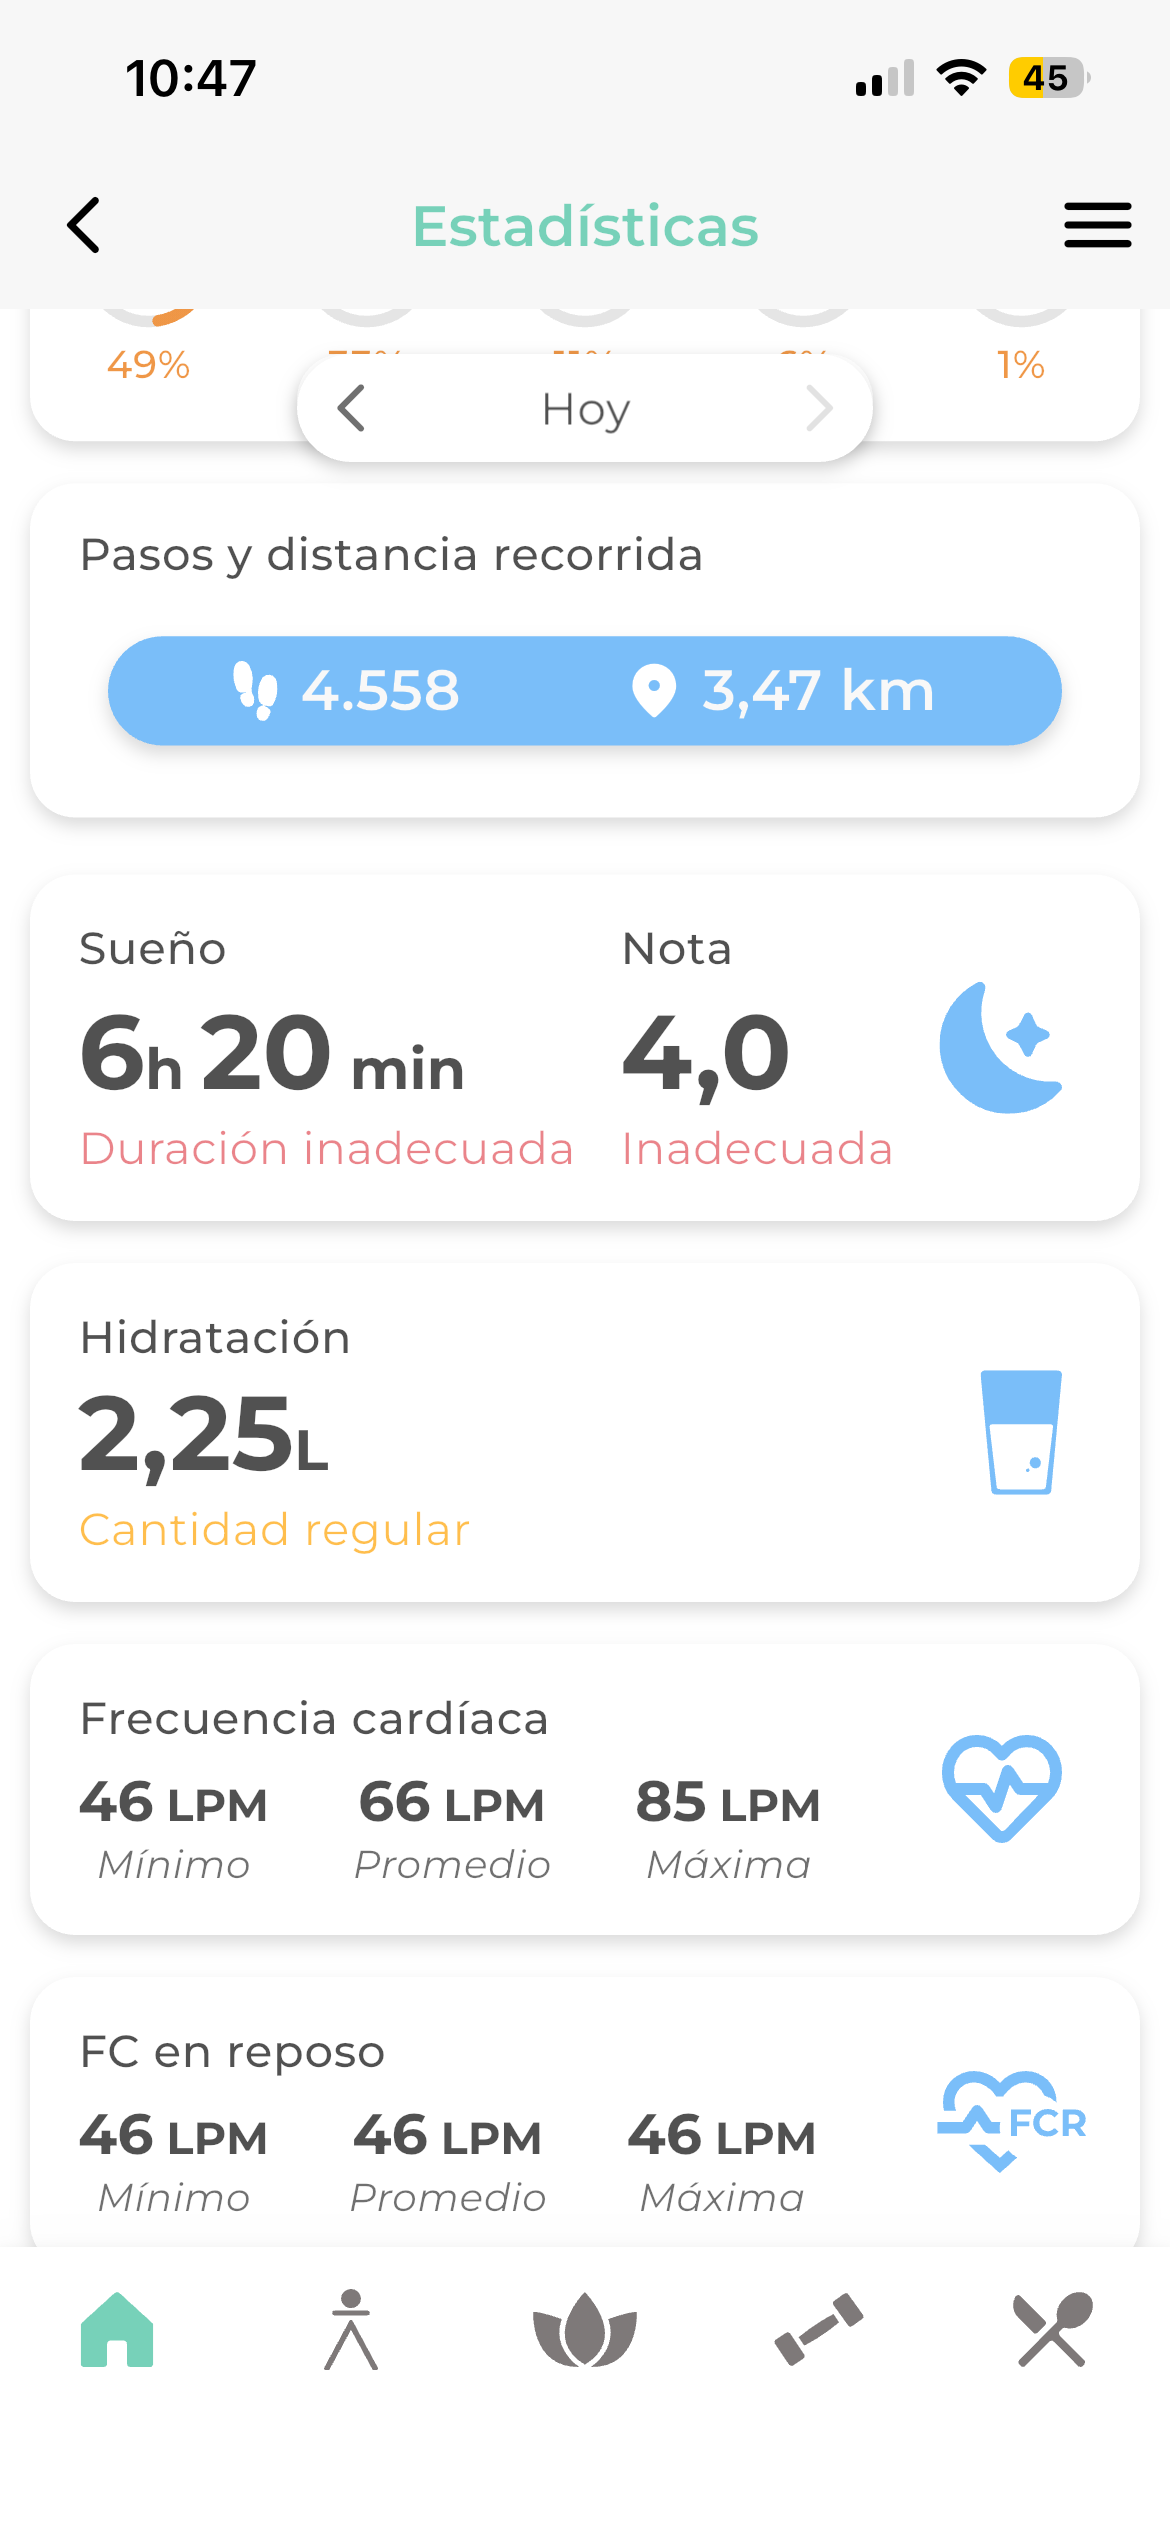
Your client opens the app and sees their own measurements: body composition, 3D avatar and bioimpedance, in the same detail you do.